In the last years, the smart technologies and lifestyle have gained new challenges in working, living and dwelling. On the other hand, we face the rapid trend of growing cities with increasing dense of population and diversity of city dwellers with their individual needs. The city is the place where we interact, communicate, move, share and participate.
A city often changes and is activated from bottom-up and this characteristic of its fluidity and state of continuous flux strongly seeks for a feature of its responsiveness and adaptability. More specifically, it appeals for such systems that can adapt to local specificities and citizens necessities with the impact on their spatial and geometrical qualities and with a consideration to urban density, internal space, connectivity, diversity and in respect to differentiated local climate zones. But how can participants directly influence their environments towards better livability in respect to their desires and preferences?
Nowadays, the citizens are not really involved in the planning, design and decision making processes in the cities. Each citizen has own understanding what are the best criteria of livability, which very often differ from experts’ views. The main idea of this project was based on bottom-up requirements and tailored preferences of people engagement in rapidly changing societies, climate and broader cultural conditions. The research referred to the social and environmental needs and the ability of the cities to adapt according to users’ necessities.
The goal of this research project was to gain new ideas of livability directly taken from the citizens and to develop a customised on-line platform where an urban environment can be sketched, proposed, modeled or re-modeled, explored and understood directly by the citizens taking into account their own preferences, desires and knowledge. Such an approach delivered efficient and novel urban participatory platform, accessible on-line and off-line that the citizens can interact and work with and in that way contribute to better livability in their neighbourhood, district, city. It had led to an activation of citizens with broader social impact that improves livability in our contemporary and future cities.
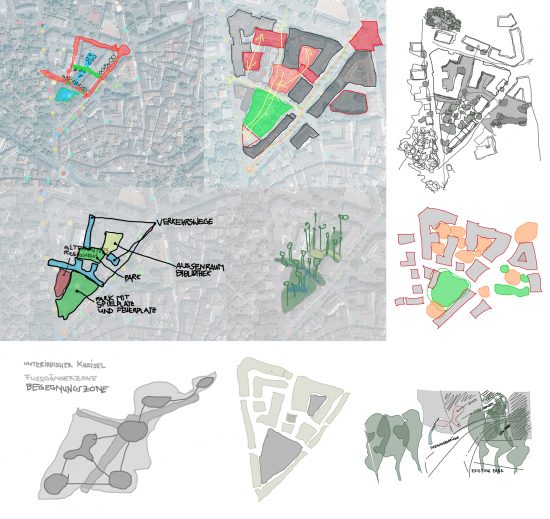
The research in the first phase addressed the engagement of information technologies used for idea sketching in participatory design workshop related to local urban issues in the city of Chur in Switzerland by means of the Skity tool, the sketching on-line platform running on all devices. The Skity tools allows user, which can be individual citizens or a community, to sketch, build, and adapt their ideas for the improvement of an urban locality.The content of this research was focused on the participatory design research project conducted as a study at the ETH Zürich and the Hochschule für Technik und Wirtschaft HTW in Chur in collaboration with Future Cities Laboratory in Singapore.
Contact:
Peter Buš | bus@arch.ethz.ch | +41 (0) 76 278 6087
Tanja Hess | tanja.hess@htwchur.ch | +41 (0) 81 286 37 28
Researchers Involved: Lukas Treyer, Hangxin Lu, Katja Knecht (FCL Singapore)
Webpages:
http://futurecitymodel.arch.ethz.ch/
Citizen Science exhibition
Future City Model at Schweiz Forscht
A Research Project from ETH Zurich and HTW Chur


Supported by

Media partner

Slides – Urban Patterns Formation: Bottom-up Patterns | Emergent Urban Strategies
Exercise 4
Download any topography data (any GeoTIFF relief -Digital Elevation data from https://geodata4edu.ethz.ch/portal.jsp or earthexplorer.)
Convert to JPEG, import the file to Rhino, make a surface from an image. Use Grasshopper definition, e.g. here.
Tessellate the surface by means of appropriate method (e.g. Voronoi or others according to the morphological characteristics of the land area) and scale the subdivided parts according to the prefered attractor points or prefered typology of urban formations. (You can use several attractors on a curve). Try several possibilities of scaling / transformations / formations.
Populate the tessellated surface with buildings in relevant form (e.g. use and scale the shape of plots) according to certain rule-set (e.g. distance restrictions from attractor points, connectivity with the road network, etc.)
Simulate the growth of the city and analyse it by means of previously introduced analytical methods.
Study the video tutorials. Bring your own ideas to the system, change certain characteristics, try to use any other modelling methodologies or techniques/parameters. Prepare/send us your questions.
Video Tutorials:
Topography definition
Voronoi Tessellation
Scaling according to the first attractor point
Curve as a second attractor
Patterns’ Growth
Buildings’ mapping on surface
Network mapping and Path detection
Other types of tessellation:
Hexagonal
Square
Spiral
Templates for the documentation (you can use more pages again):
Word: template
InDesign: template
Deadline – extended 07.11. 2016
Slides : Choice measurement, Visibility in Space Syntax: Isovist and Isovist Fields
Exercise:
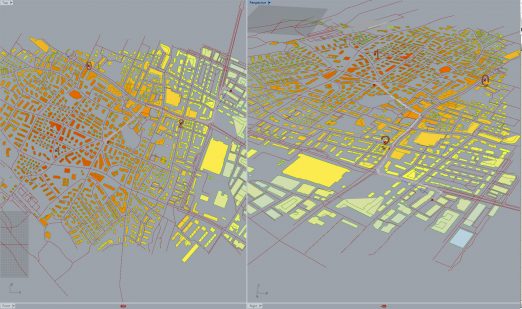
- Continue working with the street network you already have or choose your own neighbourhood you know well. Measure and try to identify local centres within selected parts of a network (using the Segment analysis component from the Decoding Spaces toolset). Try to intrepret the results, compare them with your own experiences.
- Choose the neighbourhood you know, bring a couple of photographs of your prefered space in the city (from a pedestrian’s point of view).
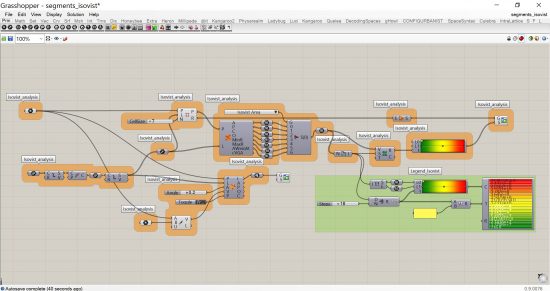
- Make the Isovist and Isovist Field analysis of your choosen neighbourhood (using Decoding Spaces Components or standard Grasshopper components) and interpret the results. Compare them with the photographs or your own experience. Keep in mind real scenarios (real measures), it will help you to better interpret the results.
Video Tutorials can help you to setup the definitions:
Isovist analysis – standard Grasshopper components
Isovist Field analysis 01 – preparing the grid – standard Grasshopper components
Isovist Field analysis 02 – Isovist Area, Perimeter, Occlusivity – standard Grasshopper components
using DecodingSpaces add-on:
Segment analysis (Choice)
Isovist analysis – individual point
Isovist Field analysis
Working files (GH definitions):
link
Templates for the documentation (you can use more pages again):
InDesign: exercise template.
Word: template template.
Deadline: 17. 10. 2016
Slides: Spatiality, Intro to Space Syntax, Connectivity, Accessibility, Path Detection
Links: Open Street Map, Grasshopper3D, Food4Rhino
Exercise:
Import Open Street Map data into the Rhino | Grasshopper interface. Analyse the imported geometry in terms of Integration measures, Accessibility (Catchment) and Shortest Path detection. Try to use various positions of Points of Interest and analyse each of them with various weights values (level of importance).
Video tutorials:
Open Street Map data into Rhino | Grasshopper -Elk I
Open Street Map data into Rhino | Grasshopper -Elk II
Distance Network Analysis
Integration measures: Proximity and Vicinity
Accessibility (Catchment), Shortest Path detection
InDesign: exercise template.
Word: exercise template.
You can use more pages of templates for the documentation.
Deadline: 10.10.2016